Displaying organizational hierarchy for Bouvet
 erik-leven
 palandreassen
October 13, 2020
palandreassen
October 13, 2020
Bouvet is an IT consultancy firm with customers involved in sectors ranging from energy supply to health services. With over 1500 employees in over 100 departments, and data spread across multiple systems, Bouvet uses Sesam’s integration platform to provide customer, event and HR data to their employee page, “Min Side”. Through Min Side employees can look up information regarding themselves, other employees, customers, useful tools and much more. One of Sesam’s responsibilities regarding Min Side is to provide data resembling the organizational structure of Bouvet. The end product is an organizational map where employees can browse the hierarchy and view each department and its employees.
Source data
Through the REST API of Bouvet’s HR system we have live imports of both department and employee master data into Sesam. Every department contains a department ID as well as the ID of their hierarchical parent department. Correspondingly, each employee contains both an employee ID and the ID of the department they work in, amongst a plethora of other data. This is all we need to replicate the organizational structure of the company.
Target data structure
A benefit of integrating through a platform with a flexible transformation language is that you can model the data to best meet the customers requirements and support their needs. In this case we concluded, together with the backend web developers of Min Side, that a single JSON object with nested lists and dictionaries representing the hierarchy of the company’s departments would best meet their requirements. Each department would take the form of a dictionary where all its sub-departments are stored in a “departments” list property. The departments would need a list of employees, where each member is a dictionary with a UID, a name and a hiring date. Additionally, each department would contain the department name, description and manager, a list of connected Slack channels and the number of employees in the department and its sub-departments.
Sesam also provides user data to Min Side for all of the company’s employees. This payload is composed of user data from many different source systems, and is kept up to date as the source data changes. The user data for Min Side includes personal data, contact information, profile images, access rights, work experience and more. By adding the employee UID’s to each department in the hierarchical structure, employees in the organizational map can be connected to their personal profile on Min Side.
Connecting data
Inside the Sesam datahub, Bouvet stores all its data in global datasets. Data from different sources regarding the same object is combined into large objects and stored in a global dataset together with other semantically related data. To put the organizational map together we had to combine department data from the “global-department” dataset with employee data from the “global-person” dataset. Using the department dataset as the main data source for the pipe that builds the payload we could add data to the output from the person dataset using hops.
Hops
Hops is a core function in Sesam’s own coding language DTL which can access all datasets in the hub. A hops function contains a join expression which specifies the conditions for a join to happen. When the conditions are met the hops join the data from both datasets such that transformations can be done on the joined data. The join expression is an equality function that specifies which attributes of the entities in the different datasets have to match. When possible the join expression refers to related IDs on the entities, like primary and foreign keys. It could however refer to any attribute or contain logic which may make the equality resolve as true. If the join expression resolves as true the join is performed.
["hops", {
    "datasets": ["global-customer gc"],
    "where": [
        ["eq", "_S.customerID", "gc.id"]
    ]
}]
The above DTL code is an example of a hops config to join customer data to an order object that has a customerID.
Dependency tracking
One of the pitfalls of joining data from different sources, like in the hops function, is to keep track on the dependencies. If a department inside the dataset global-department dataset changes, that change will naturally permeate all the down-stream integrations that uses global-department as a source. But what if an employee from global-person changes name? How will that change be registered in the target payload? A normal strategy to remedy this issue is to reprocess all the data connected to the join, thus making sure the final result includes all the latest data. This however is not needed in Sesam. Dependency tracking is an integrated feature in Sesam where in each hops, Sesam performs an indexation of the to-be-joined data. Should Sesam detect any changes in the global-person data, the entity from global-department connected to this global-person entity is reprocessed, thus we ensure up-to-date data with minimal reprocessing.
Aggregating employee count
Standard hops serves us well when creating the main department structure for the payload. However, when summarizing all the employees of a department and its sub-departments we need recursive hops to be able to progress through all of the child-departments of a specific department.
Recursive hops
The hops function supports recursion. If recursion is enabled for a hops the result of the first hop will be the input of a subsequent hop with the source variable then referring to the entity returned by the previous hop. That result will then be the input of the next hop, and so on.
["add", "sum-level",
    ["sum",
        ["values",
               ["apply-hops", "member-count", {
                "datasets": ["global-department gds"],
                "where": [
                    ["eq", "_S.departmentID.value", "gds.PARENT.departmentID.value"]
                ],
                "recurse": true,
                "exclude_root": true
              }]
        ]
    ]
]
This recursive hops to global-department is used to determine the number of employees in a department and all of its sub-departments. The hops will join any department that is hierarchically under the root department. Every time the hops finds a department that matches the join expression it will run that department entity through the “member-count” rule. This rule only copies the integer “member-count”, which is an attribute added to the departments in the global-department dataset, reflecting how many employees are in that specific department.
"member-count": [
        ["copy", "member-count"]
  ]
Once the hops has exhausted the hierarchy under our root department the member counts for all the departments is returned in a list like this:
[
      {
        "member-count": 11
      },
      {
        "member-count": 30
      },
      {
        "member-count": null
      },
     ...
]
Finally, applying the sum function on the values in this list we end up with the number of people employed in the root department and all its children. This number is added as “sum-level” for all departments in the organization to be displayed in the visualization of the organizational map.
The payload
Below we have added a simplified example of the hierarchical structure where only the department’s department name and the total number of employees in its hierarchy is included. As we can see, Sesam’s DTL allows us to both access all the data we need, but also to create a new data structure depending on the need of the situation.
{
  "_id": "1",
  "departments": [
    {
      "departments": [
        {
          "departments": [
            {
              "departments": [
              ],
              "departmentname": "Bergen Felles",
              "sum-level": 10
            },
            {
              "departments": [
              ],
              "departmentname": "Ulriken",
              "sum-level": 15
            },
            {
              "departments": [
              ],
              "departmentname": "Gullfjellet",
              "sum-level": 20
            }
          ],
          "departmentname": "Region Bergen",
          "sum-level": 500
        }
      ],
      "departmentname": "Bouvet Norge AS",
      "sum-level": 1000
    }
  ],
  "departmentname": "Bouvet ASA",
  "sum-level": 1500
}
The code below is an example of one of the sub-departments.
{
  "department": [
  ],
  "member": [
    {
      "name": "Emma Employee",
      "start-date": "~t2018-01-01T00:00:00Z",
      "uid": "7102"
    },
    {
      "name": "Emma Employee",
      "start-date": "~t2018-01-01T00:00:00Z",
      "uid": "7102"
    }
  ],
  "slack-channels": A test channel,
  "sum-level": 3,
  "departmentname": "Blåmanen",
  "description": "The payload for a bottom tier department",
  "manager": {
    "managername": "Magnus Manager",
    "uid": "7101"
  },
  "member-count": 3,
  "uid": "0000"
}
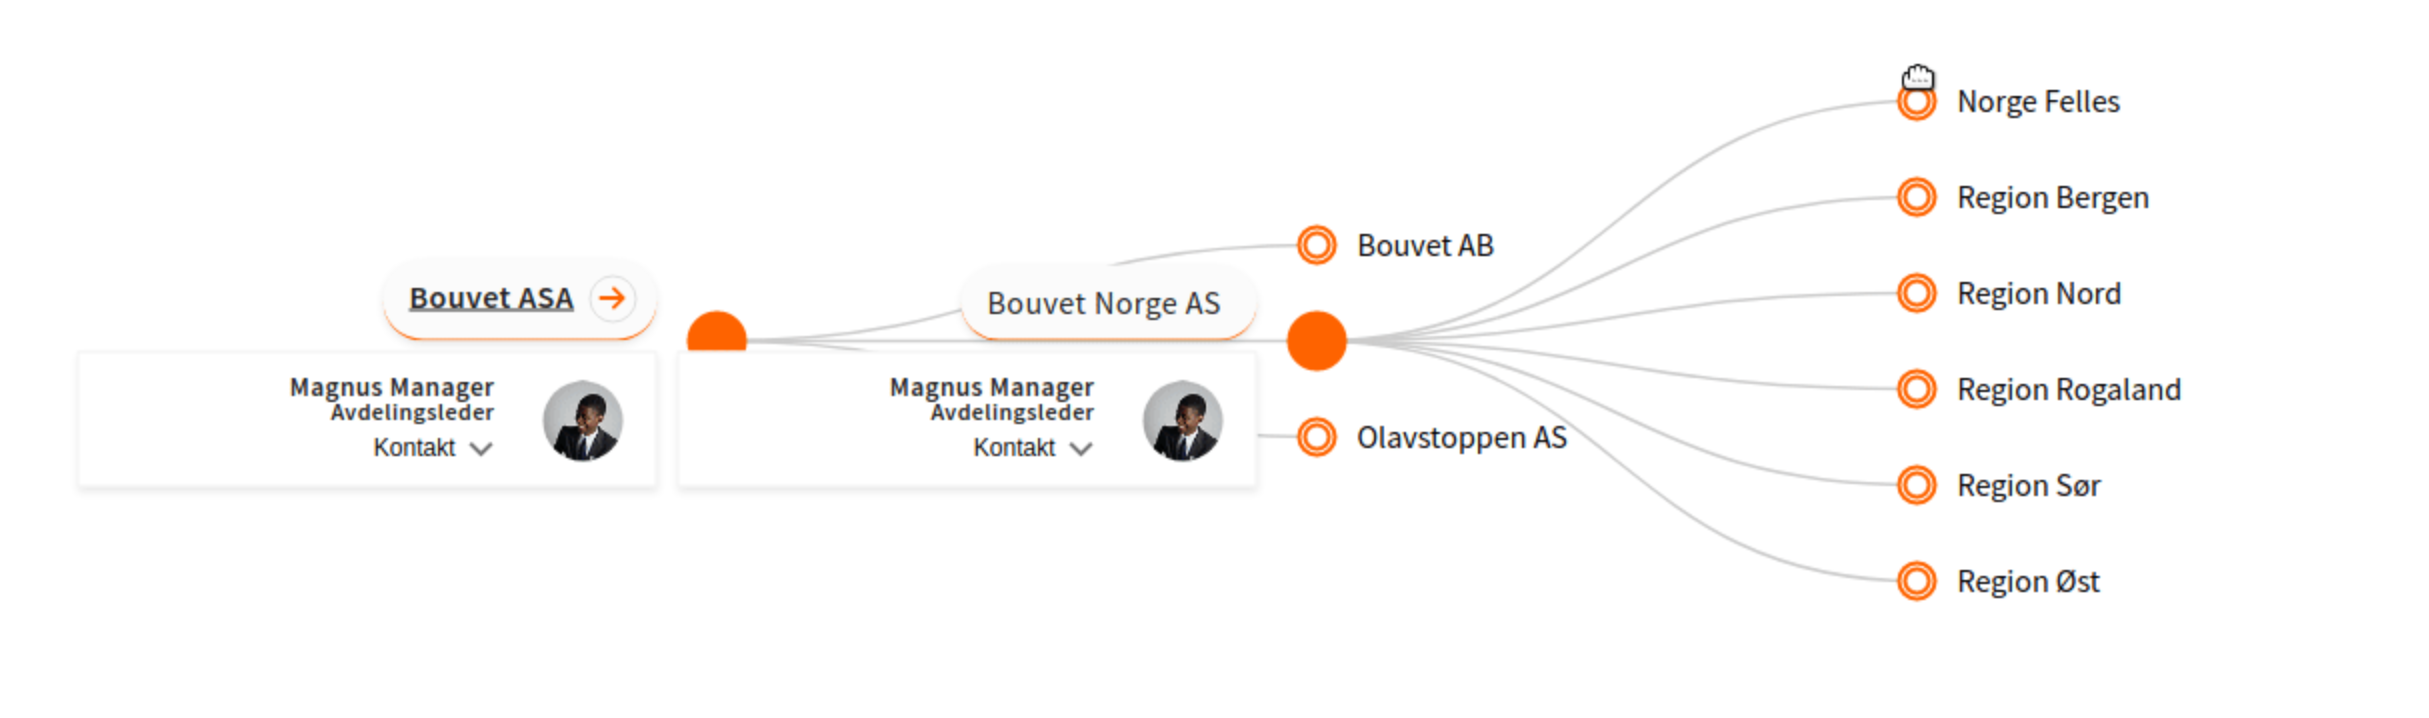
Visualization
Bouvets Min Side development team uses the organizational data provided by Sesam and has created a beautiful, interactive organizational map of the company. The map contains profile images and contact information for each employee to provide real life usability, added from user data delivered by Sesam.